Historic County Statistics
The Historic Counties Trust is undertaking a project to produce and analyse detailed statistics relating to the historic counties of the United Kingdom.
The need for statistics based on the historic counties is important for two reasons:
- To enable studies of population and other demographic indicators across decades and centuries on the fixed geographical reference frame over which our history has been played out;
- To present important contemporary national statistics on a set of units which are familiar to the public and which conform to commonly held notions of community and identity.
The results of the first stage of this project have been completed and can be found in:
The Demography of the History Counties
GIS data from the project can also be downloaded:
- Shape file of historic counties with statistical data from 2011 Census as attributes;
- CSV of Historic County with statistical data from 2011 Census;
- CSV of each Census Output Area (England, Wales and Scotland) and Small Area (Northern Ireland) from the 2011 Census along with the relevant Historic County Standard (HCS) Code.
Some key results from this publication are featured below.
Table 1. Population of Historic Counties from 2011 Census
| County | Area | Population | Density |
| (sq miles) | 2011 | (persons/sq mile) | |
| Aberdeenshire | 1,950 | 380,495 | 195 |
| Anglesey | 277 | 69,751 | 252 |
| Angus | 899 | 264,044 | 294 |
| Antrim | 1,175 | 615,701 | 524 |
| Argyllshire | 3,110 | 64,819 | 21 |
| Armagh | 512 | 178,598 | 349 |
| Ayrshire | 1,129 | 367,676 | 326 |
| Banffshire | 641 | 46,537 | 73 |
| Bedfordshire | 468 | 602,847 | 1,288 |
| Berkshire | 722 | 842,804 | 1,167 |
| Berwickshire | 457 | 26,458 | 58 |
| Brecknockshire | 742 | 67,598 | 91 |
| Buckinghamshire | 746 | 916,903 | 1,229 |
| Buteshire | 225 | 12,534 | 56 |
| Caernarfonshire | 563 | 139,065 | 247 |
| Caithness | 618 | 26,486 | 43 |
| Cambridgeshire | 858 | 460,448 | 537 |
| Cardiganshire | 693 | 75,784 | 109 |
| Carmarthenshire | 937 | 184,232 | 197 |
| Cheshire | 1,035 | 1,668,894 | 1,613 |
| Clackmannanshire | 48 | 50,957 | 1,061 |
| Cornwall | 1,365 | 533,594 | 391 |
| Cromartyshire | 370 | 7,074 | 19 |
| Cumberland | 1,525 | 306,241 | 201 |
| Denbighshire | 668 | 277,680 | 341 |
| Derbyshire | 1,017 | 1,148,373 | 1,129 |
| Devon | 2,621 | 1,133,463 | 433 |
| Dorset | 1,005 | 543,296 | 541 |
| Down | 950 | 528,983 | 557 |
| Dumfriesshire | 1,063 | 77,160 | 73 |
| Dunbartonshire | 241 | 262,419 | 1,089 |
| Durham | 1,022 | 1,467,037 | 1,436 |
| East Lothian | 267 | 74,882 | 281 |
| Essex | 1,591 | 2,999,248 | 1,885 |
| Fermanagh | 715 | 61,170 | 86 |
| Fife | 504 | 365,493 | 725 |
| Flintshire | 260 | 215,390 | 828 |
| Glamorgan | 827 | 1,321,460 | 1,598 |
| Gloucestershire | 1,293 | 1,147,106 | 887 |
| Hampshire | 1,656 | 2,099,640 | 1,268 |
| Herefordshire | 837 | 183,631 | 219 |
| Hertfordshire | 633 | 1,157,166 | 1,828 |
| Huntingdonshire | 366 | 211,776 | 579 |
| Inverness-shire | 4,211 | 118,077 | 28 |
| Kent | 1,611 | 2,747,715 | 1,706 |
| Kincardineshire | 380 | 77,670 | 204 |
| Kinross-shire | 73 | 11,223 | 154 |
| Kirkcudbrightshire | 899 | 47,546 | 53 |
| Lanarkshire | 879 | 1,008,014 | 1,147 |
| Lancashire | 1,909 | 4,942,364 | 2,589 |
| Leicestershire | 836 | 975,403 | 1,167 |
| Lincolnshire | 2,687 | 1,038,510 | 387 |
| Londonderry | 816 | 247,971 | 304 |
| Merionethshire | 676 | 37,874 | 56 |
| Middlesex | 285 | 4,000,927 | 14,038 |
| Midlothian | 362 | 621,610 | 1,717 |
| Monmouthshire | 542 | 514,723 | 950 |
| Montgomeryshire | 796 | 61,956 | 78 |
| Morayshire | 476 | 67,654 | 142 |
| Nairnshire | 200 | 13,894 | 70 |
| Norfolk | 2,057 | 807,721 | 393 |
| Northamptonshire | 998 | 838,786 | 841 |
| Northumberland | 2,019 | 797,006 | 395 |
| Nottinghamshire | 843 | 1,096,617 | 1,301 |
| Orkney | 376 | 21,349 | 57 |
| Oxfordshire | 754 | 512,345 | 680 |
| Peeblesshire | 548 | 19,074 | 35 |
| Pembrokeshire | 625 | 122,122 | 195 |
| Perthshire | 2,493 | 156,371 | 63 |
| Radnorshire | 470 | 25,821 | 55 |
| Renfrewshire | 245 | 508,064 | 2,074 |
| Ross-shire | 3,089 | 69,503 | 23 |
| Roxburghshire | 666 | 50,800 | 76 |
| Rutland | 152 | 37,677 | 248 |
| Selkirkshire | 267 | 16,010 | 60 |
| Shetland | 551 | 23,167 | 42 |
| Shropshire | 1,342 | 472,027 | 352 |
| Somerset | 1,633 | 1,053,504 | 645 |
| Staffordshire | 1,176 | 2,159,392 | 1,836 |
| Stirlingshire | 447 | 244,092 | 546 |
| Suffolk | 1,505 | 775,099 | 515 |
| Surrey | 759 | 2,975,836 | 3,921 |
| Sussex | 1,466 | 1,612,454 | 1,100 |
| Sutherland | 2,028 | 12,803 | 6 |
| Tyrone | 1,260 | 178,440 | 142 |
| Warwickshire | 918 | 1,632,885 | 1,779 |
| West Lothian | 120 | 154,830 | 1,290 |
| Westmorland | 785 | 87,466 | 111 |
| Wigtownshire | 487 | 26,618 | 55 |
| Wiltshire | 1,374 | 682,380 | 497 |
| Worcestershire | 709 | 1,125,037 | 1,587 |
| Yorkshire | 6,081 | 5,218,838 | 858 |
This table presents the areas, populations and population densities of the historic counties as defined by Defintion A of the Historic Counties Standard (HCS). These have been derived from data from the Office for National Statistics UK 2011 Census, utilising county border data from the Historic County Borders Project.
Map 1. Population Density of Historic Counties from 2011 Census
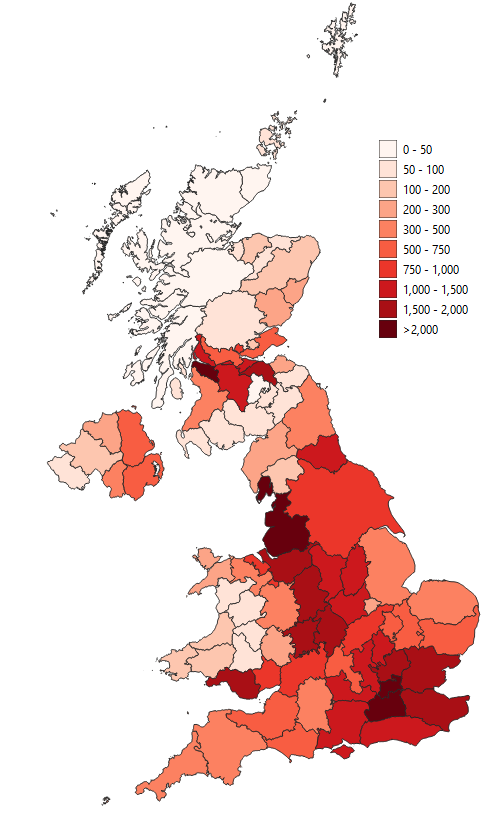
This map presents the population densities (person/sq mile) of the historic counties, calculated from the 2011 Census and presented in Table 1.
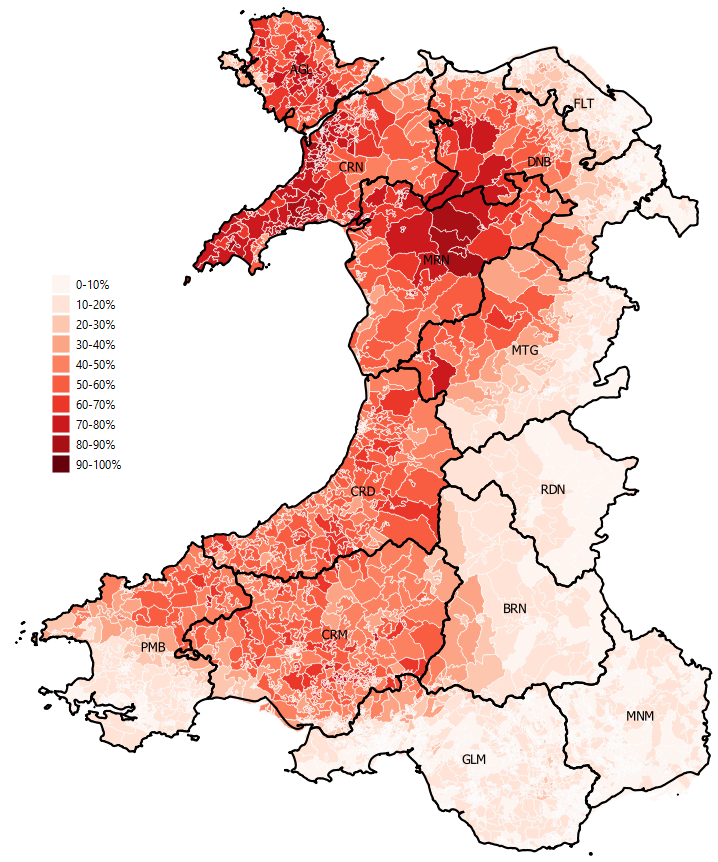
Table 2. Welsh Speakers in Historic Counties of Wales from 2011 Census
| County | Total Welsh | Percentage Welsh |
| Speakers | Speakers | |
| Anglesey | 38,568 | 57% |
| Brecknockshire | 10,272 | 16% |
| Caernarfonshire | 71,524 | 53% |
| Cardiganshire | 34,926 | 47% |
| Carmarthenshire | 78,265 | 44% |
| Denbighshire | 44,704 | 20% |
| Flintshire | 28,654 | 14% |
| Glamorgan | 148,931 | 12% |
| Meirionethshire | 21,550 | 59% |
| Monmouthshire | 46,683 | 9% |
| Montgomeryshire | 12,697 | 21% |
| Pembrokeshire | 22,607 | 19% |
| Radnorshire | 2,635 | 11% |
This table presents the total number of residents in each historic county who answered "Yes" to the question "Can Speak Welsh?" in the 2011 Census. The percentage column expresses this total as a percentage of the population total for "All usual residents aged 3 or over". These have been derived from data from the Office for National Statistics UK 2011 Census, utilising county border data from the Historic County Borders Project. The historic counties are as defined by Defintion A of the Historic Counties Standard (HCS).
Map 2. Percentage of Welsh Speakers in Historic Counties from 2011 Census
Terms of Data Use
The data from this project is licensed under the Creative Commons Attribution-Share Alike 4.0 International license.
The Historic Counties Trust would appreciate an appropriate acknowledgement of the use of the data, along the lines of:
"This [project/mapping/website/publication etc.] made use of data provided by the Historic Counties Trust's Historic County Statistics Project."
© Historic Counties Trust 2025 · Registered Charity No. 1114371 · enquiries@historiccountiestrust.co.uk · About Us